Statutory gender pay gap reporting
Gender pay gap calculator and report for the UK, Ireland and EU
Drop in a payroll export and get the measures the law asks for: mean and median hourly pay gaps, bonus gaps, quartile pay bands and, for Ireland and the EU directive, the extra splits. Each figure shows how it was worked out.
- Payroll data stays in your browser
- UK, Ireland and Directive (EU) 2023/970
- Rules checked against the official texts
What the file needs
The file is read by this page on your computer. It is not uploaded, and nothing about its contents is sent anywhere.
The sample is a synthetic company of 180 made-up employees. Every template column explained
Synthetic data: 180 made-up employees of a made-up company, so you can see every step work. or and drop your own.
Match the columns
Matched from the header row. Change any that are wrong.
| What the calculation needs | Column in your file | First value |
|---|
Check the data
Before any figure: what the file holds and what will be left out.
The figures
Every measure for this regime
The rows marked Pro are worked out once you activate Pro. The free figures above stay free. Pro is $79 once, per organisation, and adds the PDF report and the CSV files below.
Quartile pay bands
Categories of workers
The report Pro
Written statement (regulation 14): signed by a director or equivalent, confirming the figures are accurate. Their name and job title also go on the GOV.UK service.
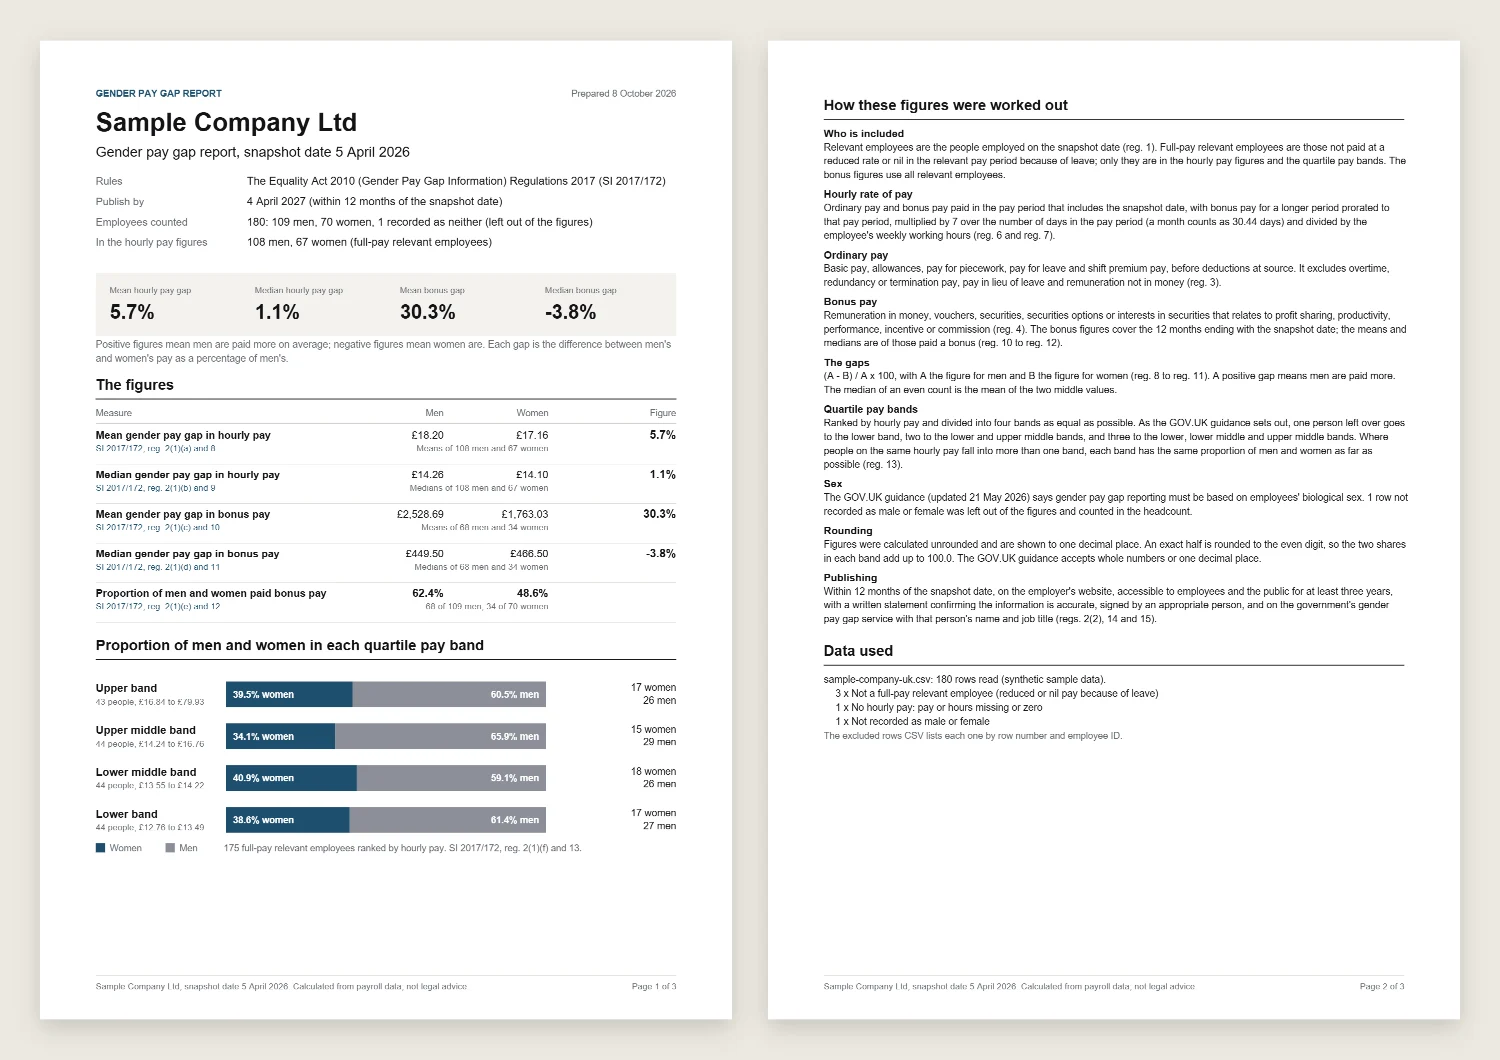
The PDF holds the figures, the quartile chart, the methodology with legal references, your narrative and, for UK private employers, the signature block.
The file never leaves this page: it is read with JavaScript on your computer, there are no analytics on this page, and the figures, the PDF and the CSV files are built here. Close the tab and it is gone.
How the figures are worked out
Hourly pay. In the UK it is ordinary pay plus any bonus paid in the pay period that includes the snapshot date, turned into a weekly amount (multiplied by 7 over the days in the pay period, with a month counted as 30.44 days) and divided by weekly working hours. In Ireland it is ordinary pay plus bonus over the 12 months to the snapshot date, divided by the hours worked in those 12 months; Irish ordinary pay includes overtime, UK ordinary pay does not. For the EU directive it is gross pay for the year, basic and complementary or variable, over the hours paid.
The gap. Every gap is (A minus B) divided by A, times 100, where A is the figure for men and B the figure for women. A positive gap means men are paid more; a negative gap means women are. Mean is the average; median is the middle value, or the average of the two middle values when the count is even.
Bonus. Bonus gaps compare the mean and median bonus of the men and women who were paid one in the 12 months to the snapshot date. The share paid a bonus divides by all men or all women, including those not paid one.
Quartiles, rounding and people left out
Quartile pay bands. Everyone with hourly pay is ranked from lowest to highest and split into four bands as equal as possible. As the GOV.UK guidance sets out, one person left over goes to the lower band, two go to the lower and upper middle bands, three to the lower, lower middle and upper middle. Where people on the same hourly pay fall either side of a dividing line, each band gets the same mix of men and women.
Rounding. Figures are calculated unrounded and shown to one decimal place. An exact half goes to the even digit, so the two shares in each band still add up to 100.0.
Who is left out. In the UK, employees on reduced or nil pay because of leave are left out of the hourly figures and kept in the bonus figures. Rows without a usable sex, pay or hours are listed in the checks before any figure, and Pro writes them to an audit file.
Sources: SI 2017/172; SI 2017/353, Schedule 1; GOV.UK, Making your calculations (updated 21 May 2026); S.I. No. 264 of 2022 as amended by S.I. No. 259 of 2024 and S.I. No. 212 of 2025; Directive (EU) 2023/970. Last checked 8 October 2026.
What the $79 version writes
A report you can publish
Load the sample company above and the free figures fill the page. The PDF below is what Pro made from that same synthetic company, in one click.
Free shows the headline
Enough to see where you stand.
- Headcount of men and women, and anyone recorded as neither
- The data checks, before any figure
- Mean and median hourly pay gap, with the working shown
- The name of every other measure your regime requires
Pro finishes the report
For the person who has to publish it.
- Every statutory measure: bonus gaps, bonus shares, quartile pay bands
- Ireland: part-time, temporary contract and benefits in kind figures
- EU: indicators (a) to (g), category gaps and the 5% flag
- The PDF report, the figures CSV for the portal and the excluded rows CSV
Pro
The full statutory report for your organisation
- Every measure for the UK, Ireland or the EU directive, from the same file
- Quartile pay bands with a chart, worked out with the GOV.UK rules for ties and remainders
- A PDF report: cover, figures with legal references, methodology, your narrative and the signature block
- A CSV of the figures, named with the GOV.UK service fields for UK reports, and a CSV of every excluded row
- One payment, for this year’s report and the years after
$79 one-time, per organisation
Buy Pro on GumroadGumroad handles payment and refunds. Your key turns on Pro in this browser; enter it again on another computer. The free figures stay free.
Questions
Is my payroll file uploaded anywhere?
No. The file is read by JavaScript in this page, on your computer, and the figures are worked out there. Nothing about the file or its contents is sent to a server, and closing the tab discards it. If you buy Pro, only the licence key is sent to Gumroad to check it.
Which employers have to report?
In Great Britain, employers with 250 or more employees on the snapshot date: 5 April for private and voluntary employers, 31 March for most public authorities. In Ireland, employers with 50 or more employees on a snapshot date they choose in June. Under the EU Pay Transparency Directive, employers with 100 or more workers, starting with those of 150 or more by 7 June 2027. The UK, Ireland and EU directive guides have the details.
What does the file need to contain?
One row per employee on the snapshot date, with their sex and either their hourly pay or their pay and hours for the period, plus bonus pay for the bonus figures. Ireland adds part-time, temporary contract and benefits in kind columns; the EU directive adds a category of workers. The CSV template lists every column.
How are employees who are not recorded as male or female handled?
They are counted and shown, and left out of the calculations. For the UK, the GOV.UK guidance updated on 21 May 2026 says reporting must be based on each employee’s biological sex, so correct those records before you publish. For Ireland, the Department’s FAQ says an employee who does not identify as male or female may be omitted from the calculations. The directive does not address it.
Why might my figures differ from my payroll software?
Usually because of what went into the file: which pay counts as ordinary pay, who is a full-pay relevant employee, which bonuses fall in the 12 months, or how weekly hours were set. The tool shows how each figure was worked out, lists every row it left out and why, and rounds only at the end.
Is this legal advice?
No. It calculates the measures from the data you give it, using the definitions in the Regulations and the directive. You still decide who is a relevant employee, what counts as ordinary pay and bonus pay, and what your report says. The employer is responsible for the accuracy of the published figures.
What does Pro include?
For $79, once, per organisation: every statutory measure for the regime you choose, the quartile pay bands with a chart, the bonus figures, the Irish part-time, temporary and benefits in kind figures, the EU category gaps with the 5% flag, a PDF report with methodology and a narrative to edit, a CSV of the figures for the government portal, and a CSV of every excluded row for your audit file.
Pay gap reporting guides
Not legal advice. The tool calculates the measures from the data you provide, with the definitions shown on this page; the employer decides who is included and what counts as ordinary and bonus pay, and is responsible for what it publishes.